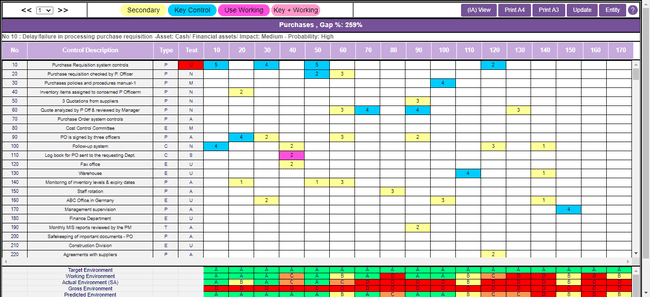
From the Entity Screen click on the "Matrix" tab in the toolbar at the top of the screen to bring up the Matrix Screen; initially this will be unscored:

The matrix shows the risk number along the top horizontal axis and the “control short description”, “control type” and the result of any Compliance Testing down the left-hand vertical axis. Further details of individual risks, i.e. “short description” of the risk, the type of attribute at risk, the impact and probability of occurrence, are shown across the top of the matrix as each column is selected.
In this case the cursor is in risk column 10; this caption changes as you move the cursor across the matrix. If you want to see the details of the risk you are in, place the cursor over the risk number and the long description will show at the top of the screen.
For controls, if you wish to see the long description, position the cursor over the short description text and again the detail will be shown across the screen.
Initially all matrices will be presented without scores. The impact each control has on each risk can now be plotted, using a scale of 1-5, where 1 = weak impact and 5 = powerful. At this point controls are scored as if they worked as intended – the result of testing the controls will be blended in later.
To enter scores, position the cursor in the desired square and type in the required number. Note that scores cannot exceed 5 and where a control has been previously described as “Detective” or “Deterrent” the system will not allow a score above 3. Whilst you can scroll down or across the matrix on the screen using the mouse or the Scroll Bar at the right-hand side, you need to move to the next page using the ![]() arrows in the top left corner of the matrix screen. Changes to existing matrices can be made at any time; scores can be overwritten. It is important to note that changes are not saved immediately, like a spreadsheet you have to save them periodically. This is done using the
arrows in the top left corner of the matrix screen. Changes to existing matrices can be made at any time; scores can be overwritten. It is important to note that changes are not saved immediately, like a spreadsheet you have to save them periodically. This is done using the ![]() button in the top right-hand corner of the toolbar at the top of the matrix.
button in the top right-hand corner of the toolbar at the top of the matrix.
“Key” controls – defined as controls with scores of 4 or 5 – are highlighted in grey (Note: as mentioned at the beginning of this manual in the Parameters section, you can change this colour scheme). If you require to change a control which has scored < 4 into a key control, then go to either the Risk Screen mitigated by that control, or the Control Screen for that control, click “Edit” and then in the Related Controls (Related Risks in the case of the Control Screen; as shown below) put a tick in the “Key” section:

When controls are tested, using the predefined Compliance Tests discussed earlier in the Controls Section, the system will capture the control’s effectiveness and apply this data across all of the risks where that control is felt to have an impact. Whilst leaving the original scores in the matrix intact, the system decrements their effectiveness, removing 1 where a control is working “Mostly”, 3 where it works “Sometimes” and negating the score entirely where a control never works. No score is allowed to fall below zero. This “broad brush” approach can have a drawback in that a control might be working “Sometimes” but the portion of it that is effective might be fully mitigating one of the many risks that that control applies to. To address this issue, we need to refine the scoring; again, this is done via either the Risk or Control screen, this time placing a tick in the “Use Working” box. This will have the effect of over-riding the “Sometimes” score and leaving the original score in place; the colour of this square is changed to magenta to show that the Compliance Test result has been overwritten (see the example of control 110 over risk 40 in the above matrix). All of these colour schemes are explained in a “key” across the top of the matrix.
At the foot of the matrix there are five rows of letters for each column. These denote the control environments relating to each risk. “A” equates to good control, “D” reflects poor or non-existent control and “B”s and “C” s are “shades of grey”. Below this are five rows of scores which are intended to reflect the overall risk environment for the Entity. The scores are derived from a table based on the following factors:
1.Importance to the organisation of the attribute at risk;
2.Impact on the organisation if the risk occurs;
3.Probability of the risk occurring if no controls were present;
4.Strength of available controls
5.Likely impact of any remedial action.
For example, the worst-case scenario is that the organisation’s most important attribute or strategic goal which has a large impact if the risk occurs with a high probability of the risk occurring without controls, and no control is present, would receive the highest score. The algorithm parameters driving these scores was fixed at the outset in the “PARAMETERS” Screen. As stated in that section of the manual, these algorithms can be tailored to suit each organisation’s requirements.
Both the letters and numbers have five elements:
•Target Environment – the risk environment that would be achievable if all risks were perfectly controlled.
•Working Environment – the risk environment produced if all controls detailed in the matrix were to work as intended.
•Actual Environment – the risk environment actually presents in the Entity as identified through the results of Compliance Testing; this will be different from the “Working” environment if some or all of the controls do not work or do not work as intended.
•Gross Score - the risk environment that would pertain if all risks were uncontrolled.
•Predicted Environment - when entering a remedial action relating to a risk and if it is a “new control” (or a “control enhancement” related to an existing control), the system requests that you enter the score of this new control (or control enhancement) against the relevant risks. The system will then predict the control environment for the impacted risk(s) and the predicted score (i.e. assuming the remedial action is implemented). So basically, the predicted environment and predicted score will show you the result assuming the remedial actions are implemented.
The scores for all the risk elements are added together to produce a series of overall scores for the Entity; again, split between Target, Working, Actual, Gross and Predicted. These can be seen at the bottom left of the matrix.
The “Target” of an Entity’s control environment is useful in that it shows what the control environment will look like with all of the necessary controls in place, this is not usually depicted as NIL (although the system could do this) since there will always be some inherent risk.
It is often useful, however, to know how the current, “real state”, control environment matches up to the “worst case” scenario; it is also helpful to know which Entities are inherently the riskiest. Obviously, this involves assuming no controls are present (i.e. the Control Environment is all “D’s”). This is referred to as the “Gross Score” and can be seen in the Matrix.
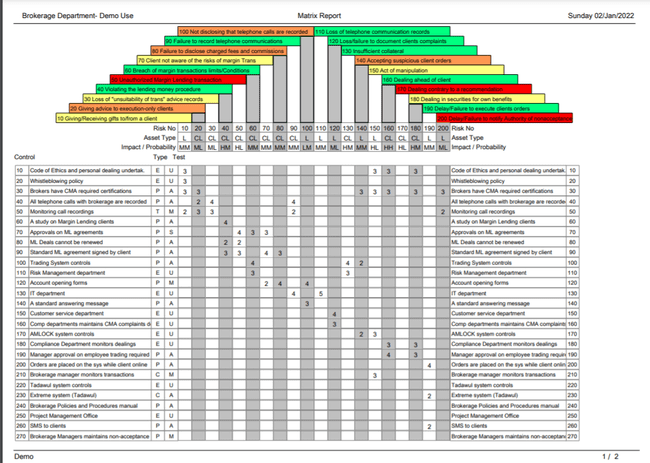
The matrix can be printed on either "A4" or "A3" paper by using the ![]() buttons in the banner at the top of the Matrix Screen. Clicking on either of these produces a screen print of what will be printed:
buttons in the banner at the top of the Matrix Screen. Clicking on either of these produces a screen print of what will be printed:

Use the print button at the top of this screen to produce the required print.
Matrix Reports – A4
These reports will print the matrix for the Entity selected on A4 landscape layout. This report can only contain up to 19 risks, for anything greater than this, A3 landscape should be used.
Entity Screen.
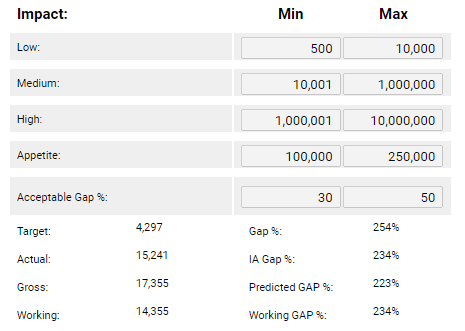
From the matrix screen click on “Entity” button to return to the main entity screen. The entity screen also highlights the Target, Working, Actual, Gross and Predicted scores mentioned earlier in this section:
