The module is accessed using the ![]() button; clicking on this brings up the following screen:
button; clicking on this brings up the following screen:
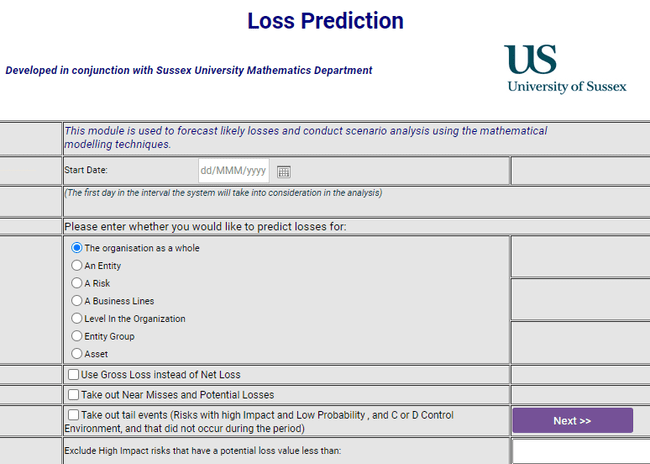
In the “Start date” field you need to enter to the system what date your event capture data starts from; i.e. how far back do your loss records go. This date is inserted by using the now familiar calendar.
Next you enter in to the system whether you want to run the scenario analysis for the whole organization (i.e. use all of the event data for every risk in every Business Unit); for one Business Unit only; for one risk only or for a Business Line. Finally, you need to decide if you wish to work with Net or Gross loss data, whether you wish to include Near Misses or not and whether “tail events” are to be included. This latter point is important since the inclusion of such events will give a much larger projected loss but is the more conservative approach since it deals with the “worst case” scenario.
Depending upon your selection, when you click on ![]() button, you will be presented with another set of options; for example, asking for the module to be run for a Business Unit brings up the following screen:
button, you will be presented with another set of options; for example, asking for the module to be run for a Business Unit brings up the following screen:
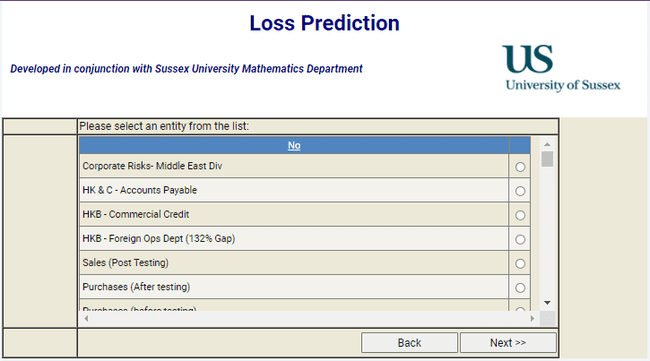
Highlight the Business Unit(s) you wish to run the model for and click ![]() and you move to the next selection level:
and you move to the next selection level:
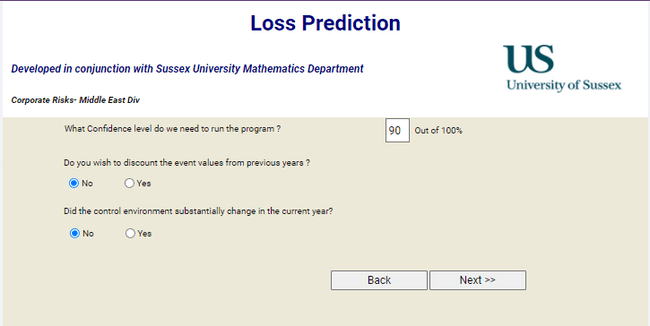
Here you can state the confidence level at which you wish to run the model; higher confidence levels will take longer to run and will give a wider range of outcomes. You are next asked, “Do you wish to discount the event values from previous years?” The reason for this question is quite logical; suppose you have loss data going back over, say, 5 years, it is highly unlikely that the organization will not have improved its control environment in that time – especially if it has sustained large losses. If we were to do nothing, the system would attribute the same weight to losses in year 1 as it does to those in year 5, which is obviously not right. What we need is some mechanism to discount the value of these early losses so as to reflect the fact that they were sustained under a weaker control environment. Clicking on the “Yes” radio button brings up the following choices:
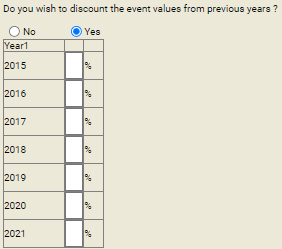
Simply decide for each year by how much you wish to discount the loss values based upon your knowledge of how much better the control environment is now to what it was in the year in question.
Equally, if we are running this model in, say, October and in the early part of this year we made substantial upgrades to the control environment, we need to be able to have our model reflect this and not simply base this year’s predictions on losses sustained under a weaker control environment. This is the reason for the second question here, “Did the control environment substantially change in the current year?” Clicking on the “Yes” radio button brings up the following choices:

As you can see, you have the option of also acknowledging that the control environment may have deteriorated during the first part of the current year! Whatever your views, enter the percentage change you feel has occurred and click ![]() , this will present you with this screen:
, this will present you with this screen:
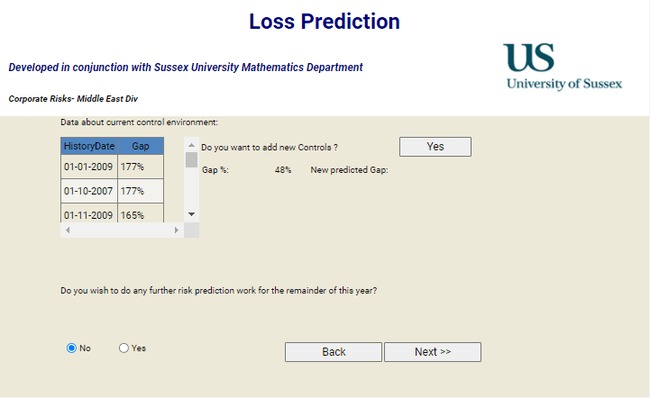
Here some data is given about the history of the Control Gap (use the scroll bars to move backwards through time) and you are shown what the current % gap is as per the Business Unit screen (155%). If you want to see the effect on the % gap of adding more controls click on Yes and you will be taken to a blank Control Screen; once you have completed this screen and saved it you will automatically be taken to the Scoring Screen, described earlier in the manual. Once you have scored this new control you will be taken back to this screen where the effect of the control you have added will be shown:
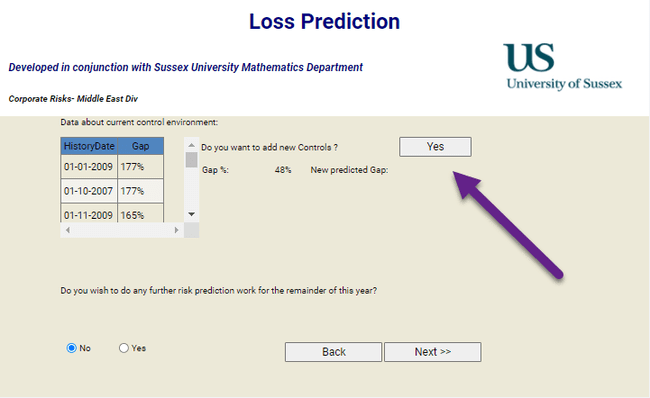
You can see that the new control that has been added has reduced the gap from 155% to 145%.
Clicking on ![]() button will run the model and produce output in the following form:
button will run the model and produce output in the following form:
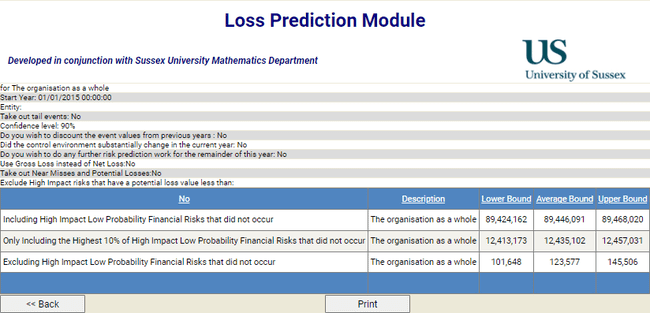
Now, earlier we saw that there is the ability to reflect the fact that the control environment may have deteriorated in the first part of the year in which you are running the model. It is equally possible that you may wish to see what the effect would be of improving the control environment in the remainder of the year; perhaps you know that control improvement recommendations made earlier are due to come to fruition soon, or you wish to show how much effect would be achieved by way of loss reduction if money were spent on control improvement. You can do this by using the:

Question on the fourth page of the module. Clicking on the “Yes” radio button will open a window into which you can enter the percentage improvement you believe will be achieved by the improved controls; clicking on ![]() runs this simulation. You can now see that the earlier section of this module that provided the ability to perform “what-if” type work with the Control Gap is helpful here; if adding controls reduced the gap from 155% to 145% that improvement increase (around 10%) is what can go in here.
runs this simulation. You can now see that the earlier section of this module that provided the ability to perform “what-if” type work with the Control Gap is helpful here; if adding controls reduced the gap from 155% to 145% that improvement increase (around 10%) is what can go in here.
One more thing needs to be considered in this module. When looking at loss prediction models we cannot only take into account the value of losses sustained over the previous X years, we have to consider “long-tail” events. These are risks that, if they occur, are estimated to have a high impact but are considered to have a low, or very low probability of occurring. During the period of time over which event details have been collected, say 5 years, such risks may not have occurred, but this wouldn’t have been considered odd since the organization’s definition of very low probability may be once every 10 – 20 years. The risk(s) in question may, however, occur tomorrow and if we have ignored the value of such risks in our modelling our prediction figures will not have taken account of this. For this reason, the Loss Prediction module identifies such risks in the database and assigns a value to them so that they can be included in the modelling. Doing this, however, means that, due to the many simulations performed by the model, it can take some time to run the module – especially if a bank-wide prediction is being run. To overcome this time issue, you can elect to omit using this attribute and simply run the model using the actual event losses. This is done using the filter at the foot of the first screen:
![]()
Checking the box will omit “long-tail” events and simply use actual data. You should only use this facility if you require a “quick and dirty” report, it should not be used, for example, for Capital Allocation work or Main Board reports requiring robust Risk Prediction figures.
The detailed examples used above are based on running the model for a Business Unit; the same modelling can be done for:
▪For the entire organisation,
▪For a particular level in organisation hierarchy,
▪For a Business Line,
▪For a Group of Entities,
▪For an Entity,
▪For a risk within the Entity,
▪For groups of risks within an Entity,
For each of these the inputs are identical to those for a Business Unit except that, for a risk you are presented with two drop-down screens on page 2 to enable you to select the Business Unit from which the risk is to be selected and the risk itself; for a Business Line, you are presented with a drop-down of the Basel Business Lines on page 2.